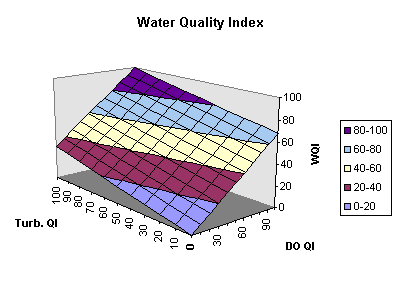
Note: The graph is not symmetric because DO is weighted higher than turbidity.
The water quality index calculation uses a weighted mean to combine factors. If total phosphates (TP) and nitrates (N) score 80 and 60, the combined value is 70. This would imply that there is one group of organisms that is sensitive to TP and another to N. Of the TP group, 80% survives the elevated phosphate levels. In the N group, only 60%. When factors are combined, the survival rate averages to 70% (80% of half plus 60% of half is 70% of the whole).
It is more probably the case, however, that of the 80% surviving the elevated phosphate levels, only 60% can cope with the added nitrates and vice versa. The chart below shows, for example, how different pH values increase the toxicity of ammonia. The alternate water quality index calculation multiplies individual factors (with weighting included in an exponent) in recognition of their joint effect. The situation might be summarized as follows:
Without further manipulation, it would be difficult to compare indices that were obtained from differing numbers of factors with each other or with the fixed 100-point scale ranging from excellent to very bad. To accommodate the need for comparison, the result from tests including factors having total weights of W is raised to the power 1/9W. In effect, the partial result based on a small number of factors is extended with like values for unmeasured indicators and then the ninth root is taken, which produces a single value which when taken to the ninth power would give the same result--as if this value summarized the others. Although values for the alternate water quality index are often very close to those for the standard water quality index, one very bad factor will influence it much more drastically, which is the desired effect.
| pH (units) | Duration | |
|---|---|---|
| 1 hour | 4 days | |
| 6.5 | 14.3 | 0.73 |
| 7.0 | 11.6 | 0.74 |
| 7.5 | 7.3 | 0.74 |
| 8.0 | 3.5 | 0.47 |
| 8.5 | 1.3 | 0.17 |
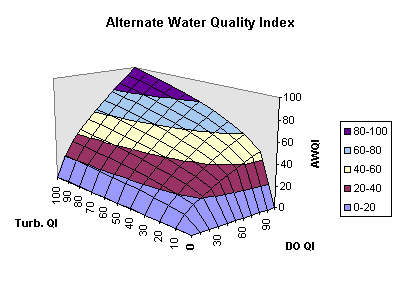
The 100 point index can be divided into several ranges corresponding to the general descriptive terms shown in the table below. The alternate water quality index will generally be lower than the standard water quality index. Values for standard water quality index at Cerrito Creek have generally been higher than expectations based on benthic macroinvertebrate samples. Therefore, the stricter range may be more accurate.
| Range | Quality |
|---|---|
| 90-100 | Excellent |
| 70-90 | Good |
| 50-70 | Medium |
| 25-50 | Bad |
| 0-25 | Very bad |